Exploratory data analysis with R
Session 8
2023-10-18
1 Working openly
1.1 Why open your work?
- Improve the quality of your work: “be more organized, more accurate, less likely to miss errors”
- Broaden reach and impact
- Foster data literacy: “others can follow and learn—which can enrich and diversify data ecosystems, practices, and communities”
1.2 How to open your work?
Consider:
- when is transparency valuable?
- when is transparency a lower priority?
- when is transparency potentially harmful?
2 Exploratory data analysis
This next section is largely excerpted from R for Data Science (2e) - 11 Exploratory data analysis.
2.1 What do you do when you do exploratory data analysis?
- Generate questions about your data.
- Search for answers by visualizing, transforming, and modelling your data.
- Use what you learn to refine your questions and/or generate new questions.
“More than anything, EDA is a state of mind.”
2.2 Use questions as tools to guide your investigation
When you ask a question…
- the question focuses your attention on a specific part of your dataset
- this helps you decide which graphs, models, or transformations to make.
- the key to asking quality questions is to generate a large quantity of questions
2.3 Two useful questions to start
- What type of variation occurs within my variables?
- What type of covariation occurs between my variables?
2.4 What are you “exploring” when you do exploratory data analysis?
General summary
When you start with a dataset, you might do something where you look at the general summary using:
2.5 Tabular summaries
2.6 Automated summaries
- DataExplorer: Automate Data Exploration and Treatment
- visdat: Preliminary Exploratory Visualisation of Data
- esquisse: RStudio add-in to make plots interactively with ggplot2
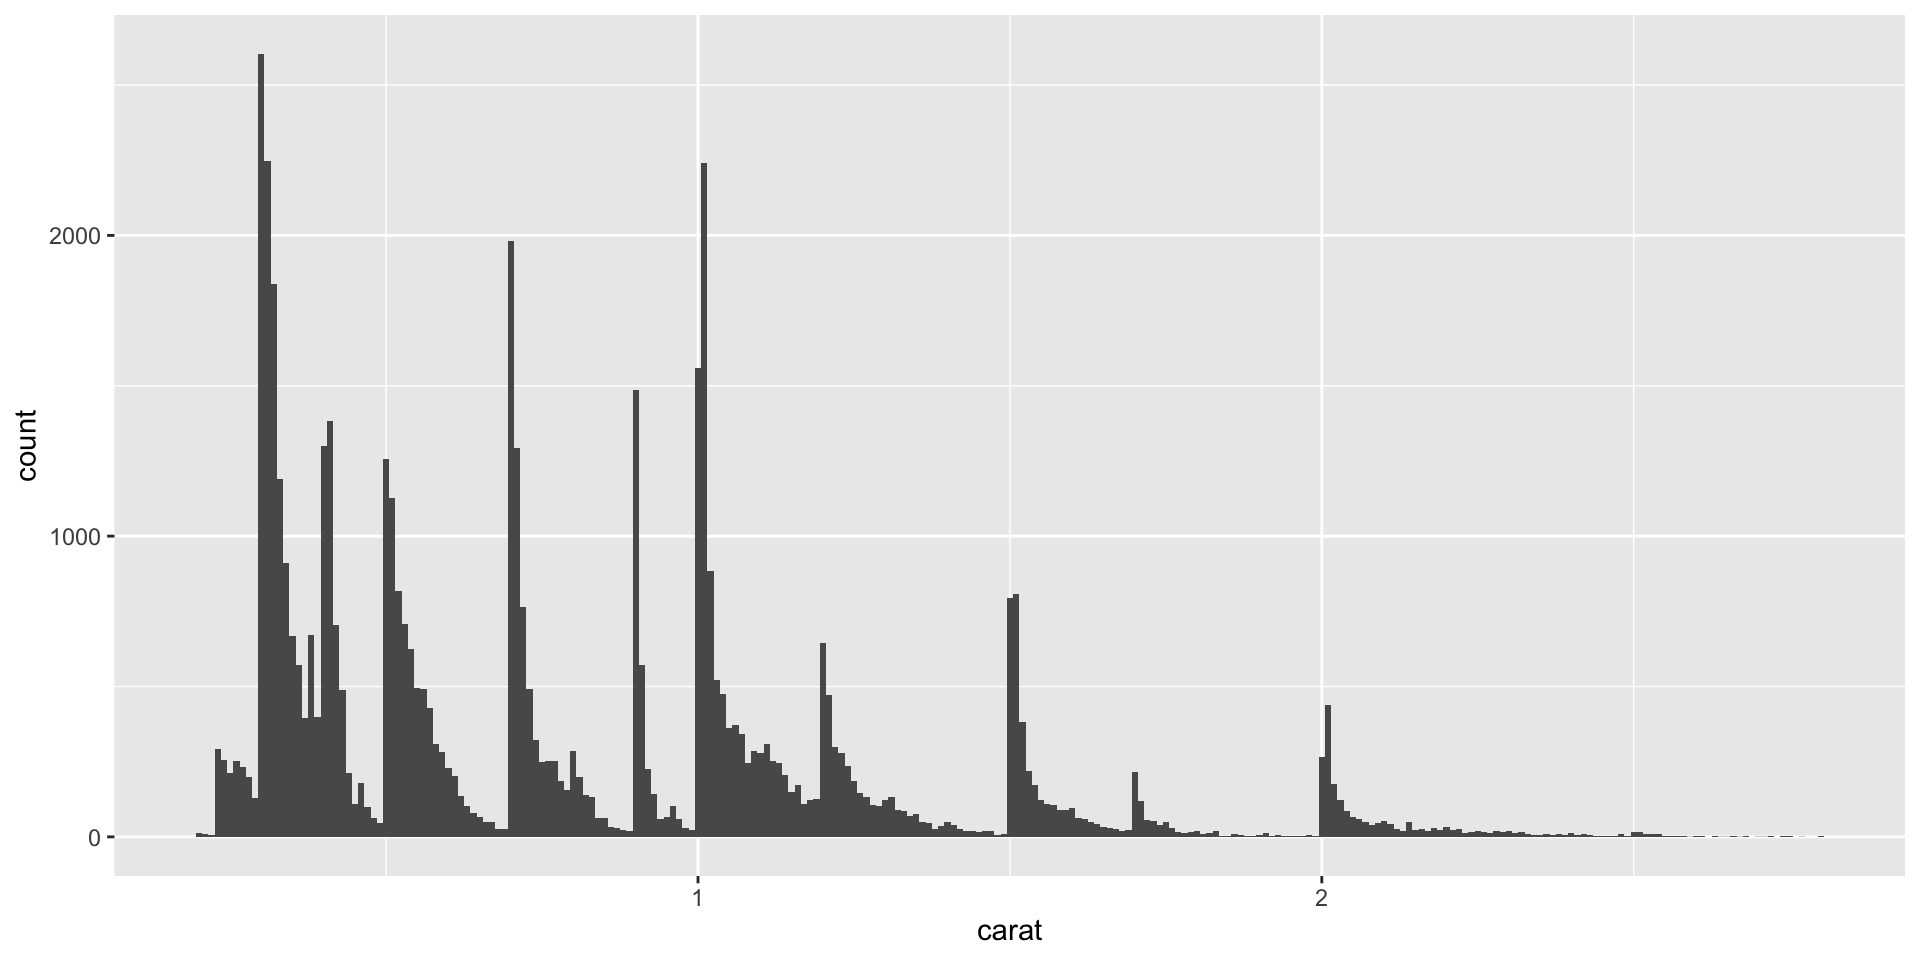
2.7 Variation
Types of values to explore:
- Typical values
- Unusual values
- Missing values*
Typical values
- Which values are the most common? Why?
- Which values are rare? Why? Does that match your expectations?
- Can you see any unusual patterns? What might explain them?
Sub-groups
To understand the subgroups, ask:
- How are the observations within each subgroup similar to each other?
- How are the observations in separate clusters different from each other?
- How can you explain or describe the clusters?
- Why might the appearance of clusters be misleading?
Unusual values
What makes a value unusual?
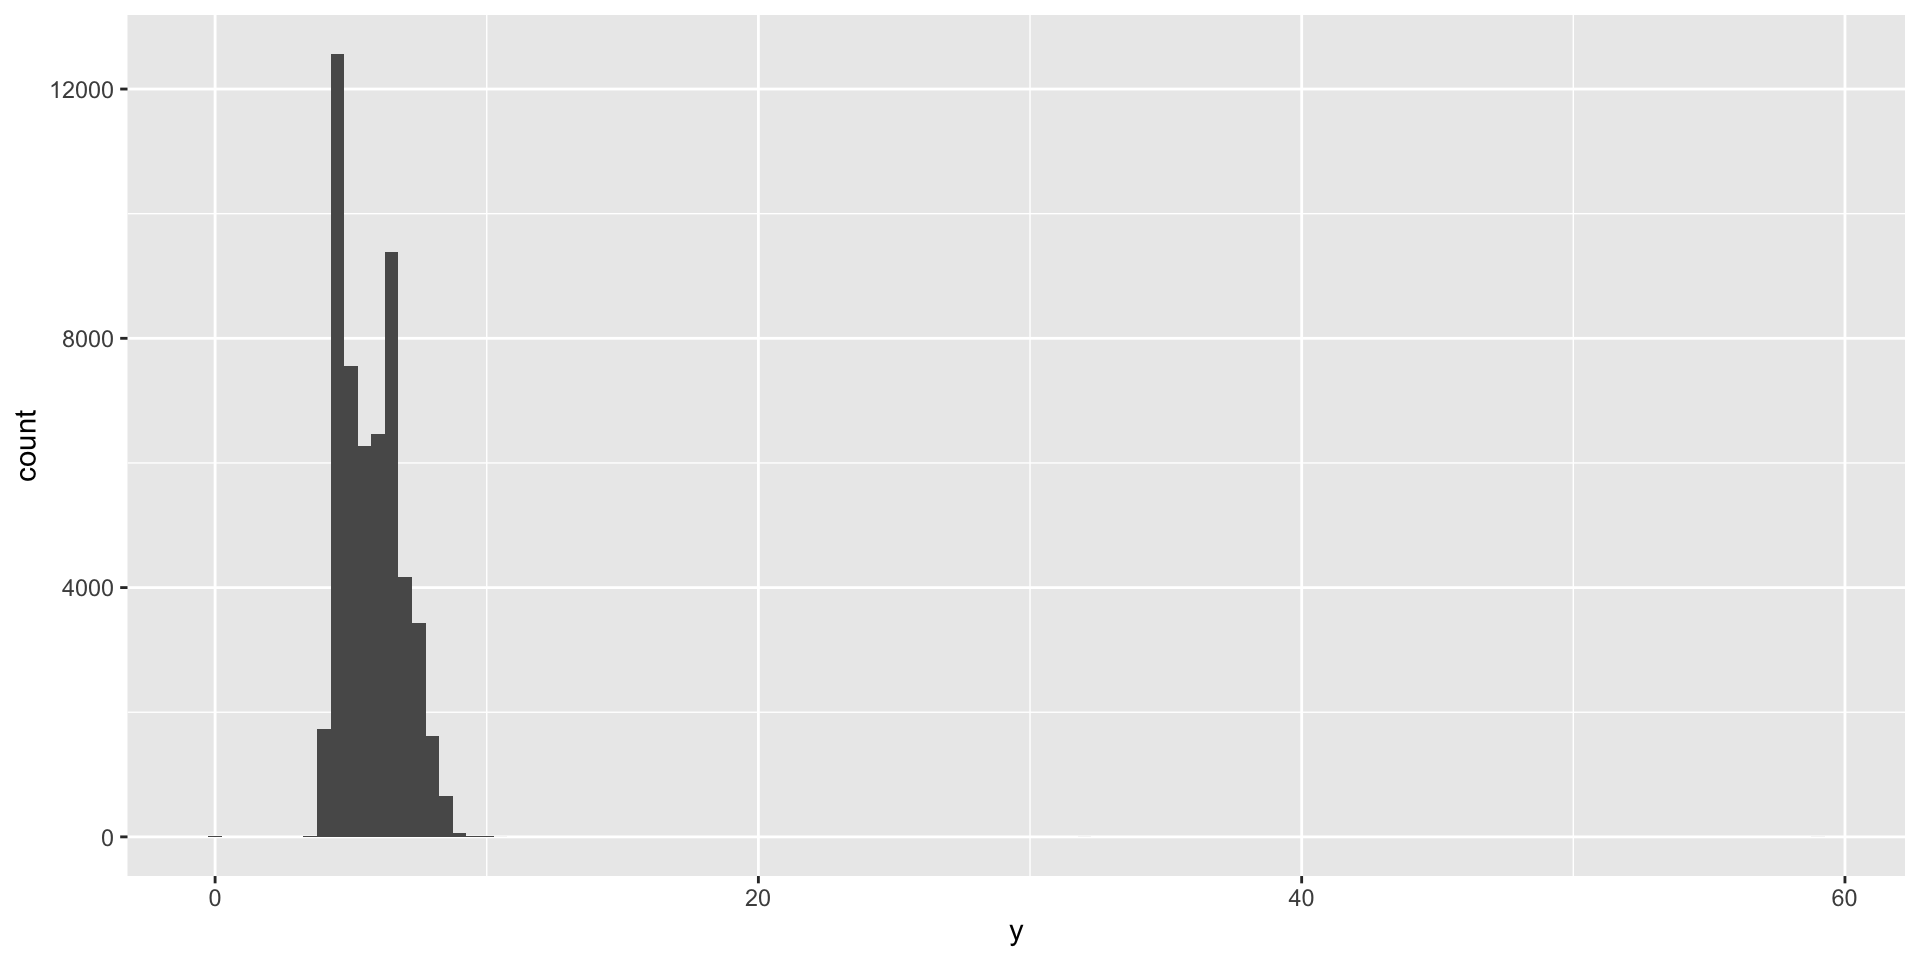
Unusual values
Handling unusual values can include:
- Dropping observations with unusual values
- Replacing unusual values with missing values
If unusual values are the result of a issue with the data import or original data collection, these issues can be addressed by re-coding or cleaning data.
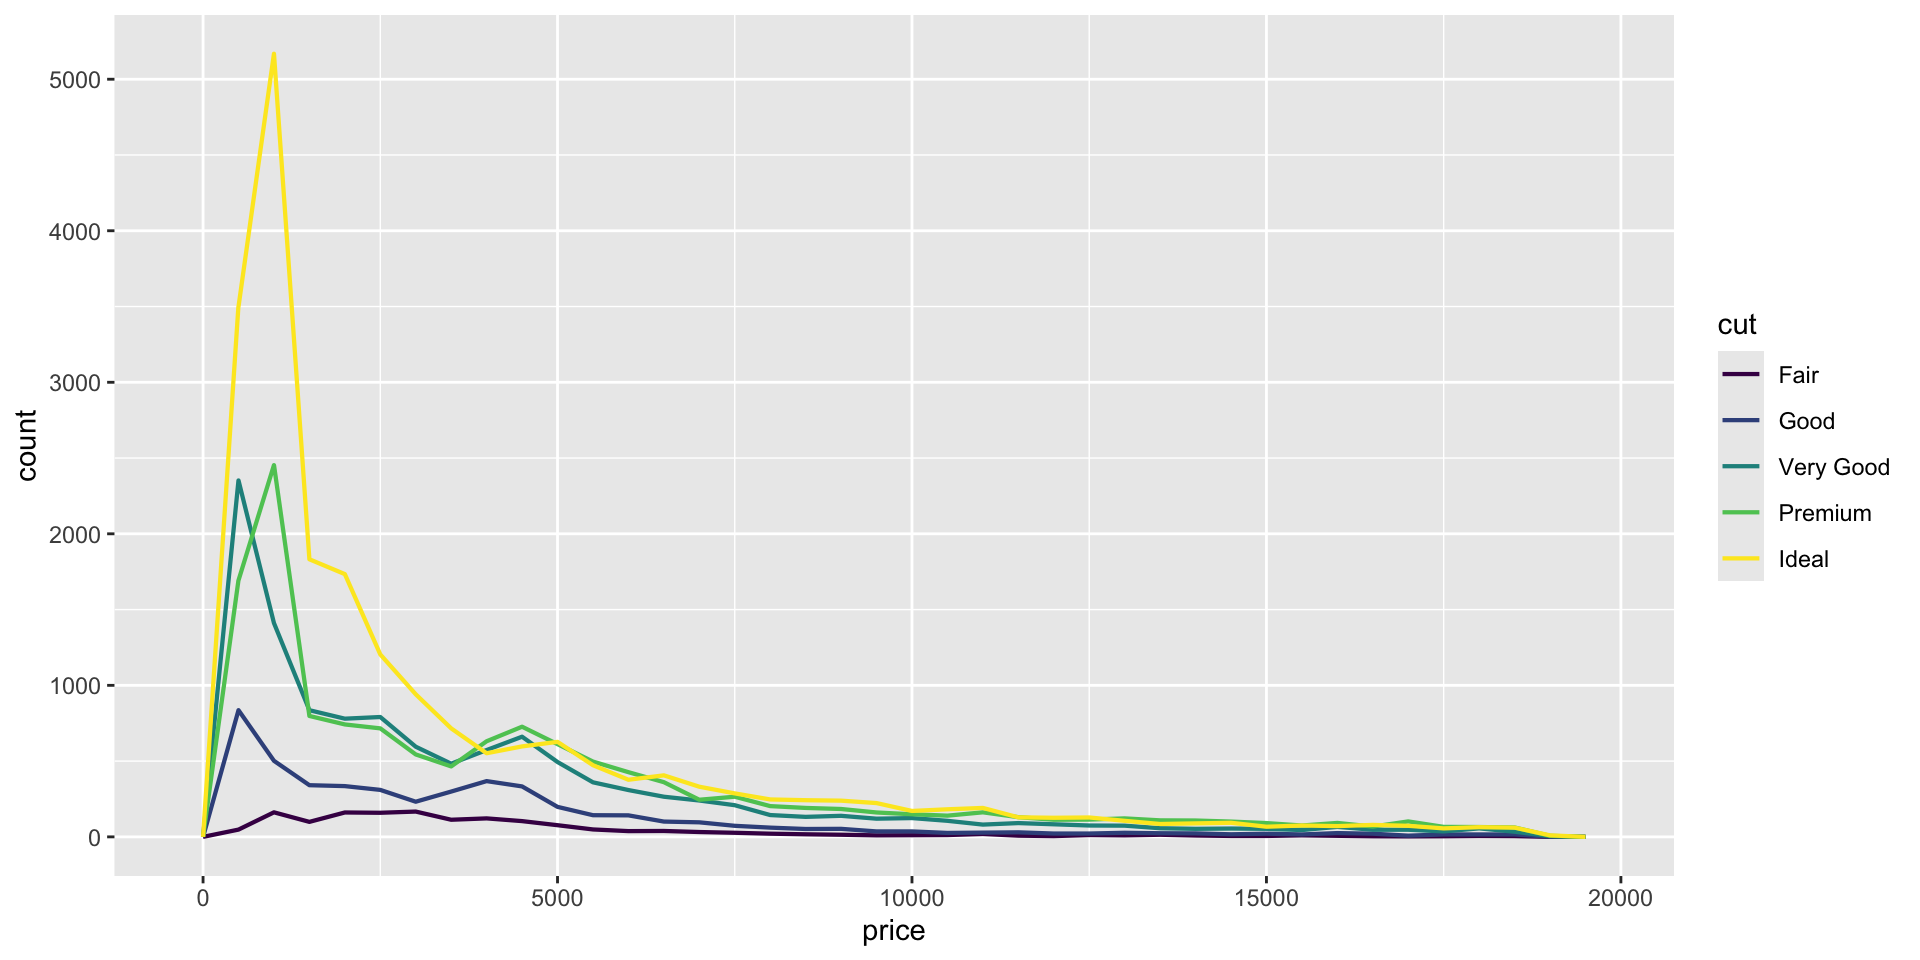
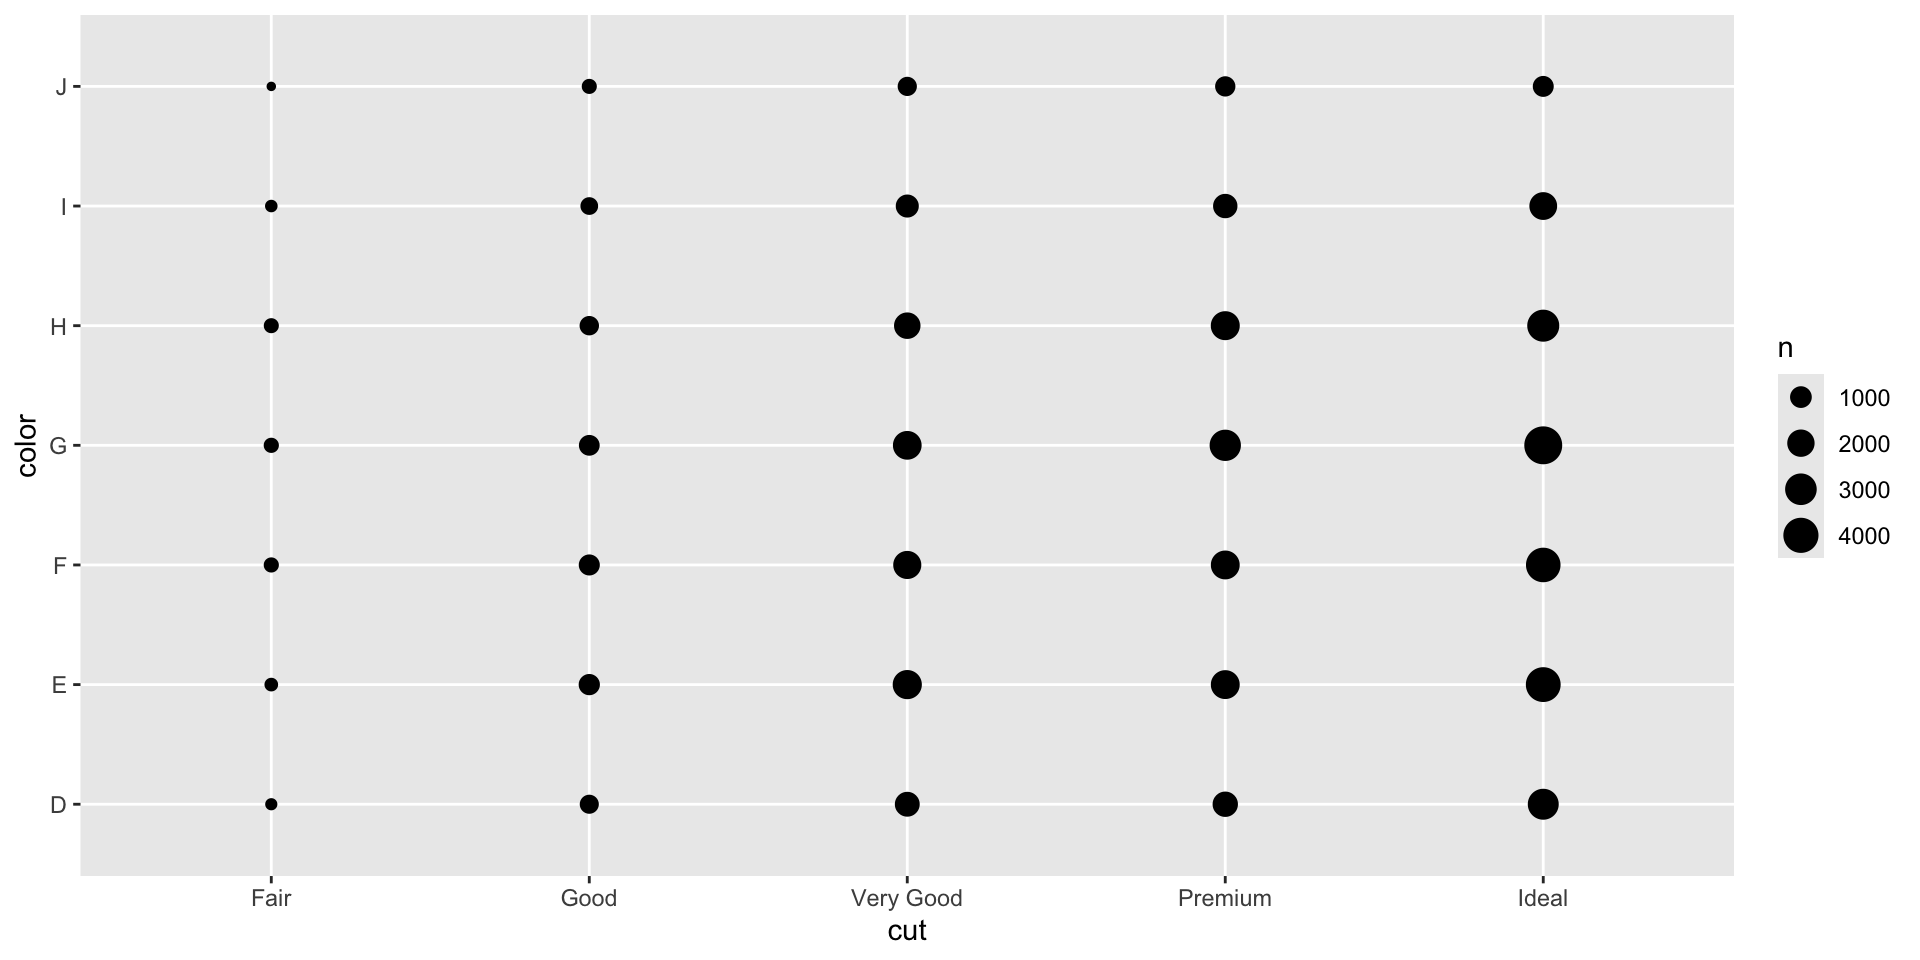
2.8 Covariation
A categorical and a numerical variable
Two categorical variables
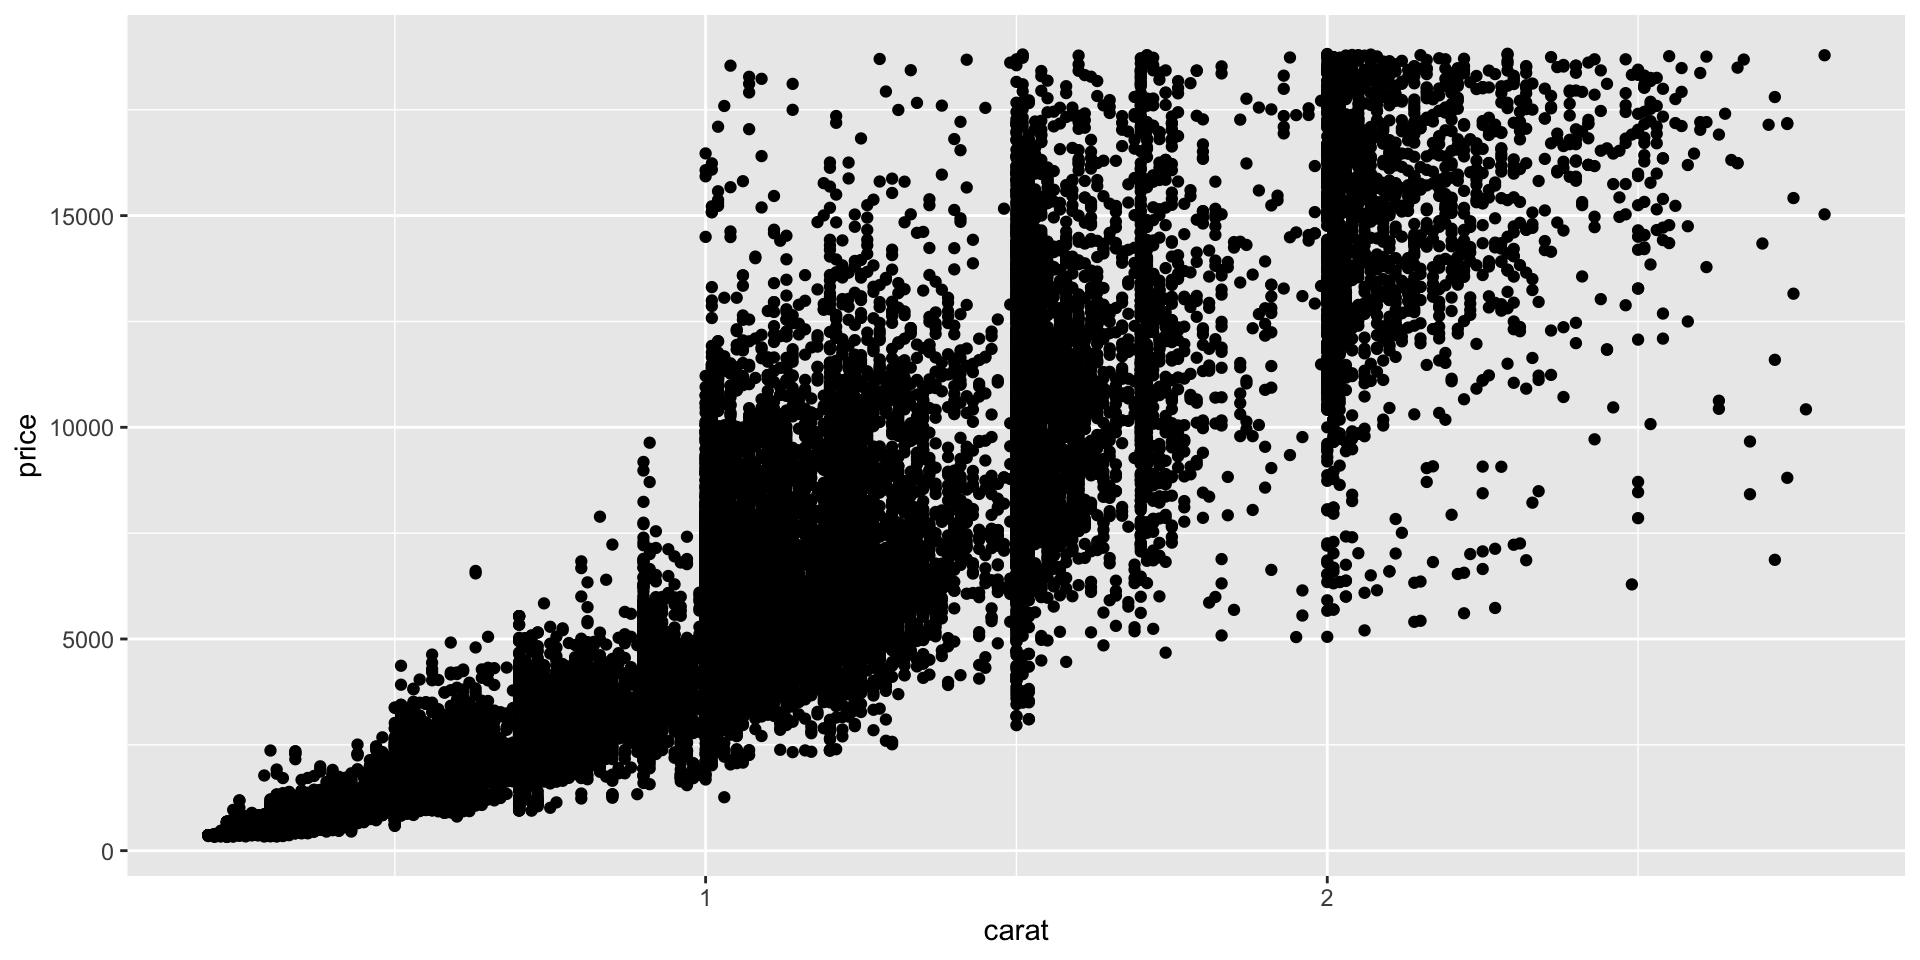
Two numerical variables
2.9 Patterns and models
If a systematic relationship exists between two variables it will appear as a pattern in the data. If you spot a pattern, ask yourself:
- Could this pattern be due to coincidence (i.e. random chance)?
- How can you describe the relationship implied by the pattern?
- How strong is the relationship implied by the pattern?
- What other variables might affect the relationship?
- Does the relationship change if you look at individual subgroups of the data?
2.10 Exploratory Data Analysis Checklist
From The Art of Data Science (2017) by Roger D. Peng and Elizabeth Matsui:
Formulate your question
Read in your data
Check the packaging
Look at the top and the bottom of your data
Check your “n”s
Validate with at least one external data source
Make a plot
Try the easy solution first
Follow up
2.11 Tools for exploring data with visualizations
Specialty packages for working with data.
Missing data
naniarprovides principled, tidy ways to summarise, visualise, and manipulate missing data with minimal deviations from the workflows in ggplot2 and tidy data.
Distributions
Visualizations of Distributions and Uncertainty • ggdist
ggdistis an R package that provides a flexible set of ggplot2 geoms and stats designed especially for visualizing distributions and uncertainty.
- What type of data do you have?
- How much time do you have?
- How do you expect to communicate what you learn?
2.12 Communicating
Codebooks
Create Codebooks from Data Frames • codebookr
The
codebookrpackage is intended to make it easy for users to create codebooks (also called data dictionaries) directly from an R data frame.
Additional packages
inspectdf is collection of utilities for columnwise summary, comparison and visualisation of data frames. Functions are provided to summarise missingness, categorical levels, numeric distribution, correlation, column types and memory usage.
Other tools
Datasette is a tool for exploring and publishing data. It helps people take data of any shape, analyze and explore it, and publish it as an interactive website and accompanying API.
![]()