Exercise 07
ℹ️ See week 7 for related slides and readings
1 Setup
To start this week’s exercise, I have created a new folder named project in each of your class repositories (based on the new public project-template repository for our class). Sync your repository to make sure you have the latest files before you get started with the exercise.
In the folder you will find a new RStudio project file (.Rproj) named project.Rproj. Open the project and locate the file named example-functions.qmd.
Open example-functions.qmd and, in the editor pane of RStudio, click the “Render” button to turn the Quarto document into a rendered HTML document in the “Preview” pane.
This Quarto document is designed to review the topics we covered in last week’s class and to show some of the options for Quarto documents. You can review the document or, if you feel confident in the material, jump ahead to the exercise.
2 Exercise
Here are the steps to complete this week’s exercise:
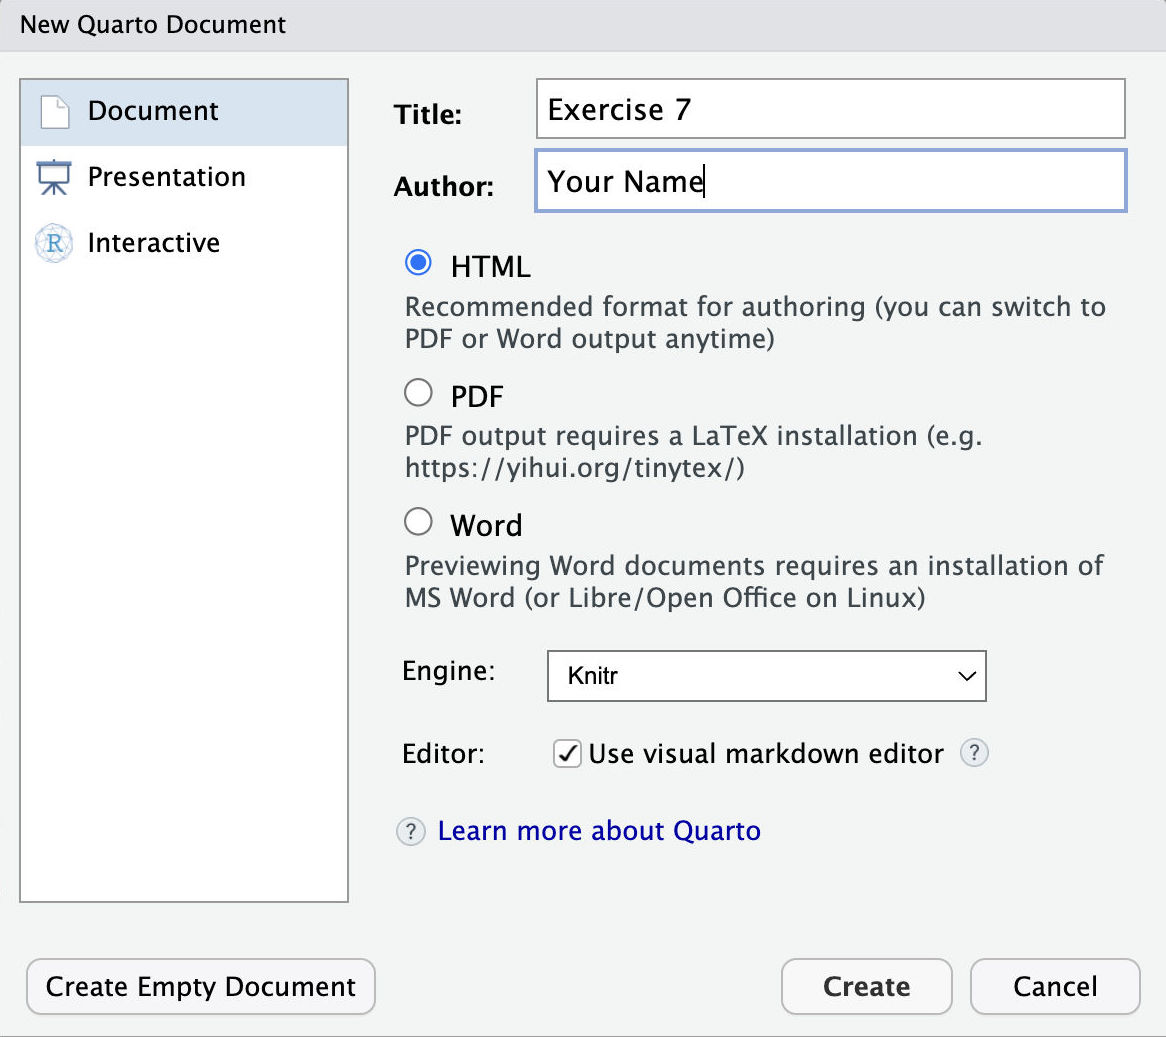
- Use the menu to create a new Quarto document (Go to
File > New File > Quarto Document...). Fill in the title “Exercise 7” and your name as the author. After the new document opens, notice how the title and author appear in the front matter for the new document.
Save the Quarto document using the file name
exercise_07.qmd.Insert a new code block and add code to read spatial data into R. You can use
sf::read_sf()to read data from a URL or file path or you can use one of the data functions we’ve tried in class, such astigris::counties()orrnaturalearth::ne_countries(returnclass = "sf").
Don’t forget! If you are using a local file, the file size must be less than 50MB or your changes to the repository can’t be committed to GitHub. If your file is not a spatial data file (e.g. a CSV file) you should convert the object into a sf object using sf::st_as_sf().
Insert a new code block and write a vector function (either a “mutate” or “summary” style function) that can take one or more attributes from your data as an input. Include one or more examples of how the function works.
Insert a new code block and write a vector function (either a “mutate” or “summary” style function) that can take the feature geometry from your data as an input. This function should use one of the geometric unary or binary functions from the
{sf}package. It doesn’t need to be complicated but take a look at the function reference or the sf cheatsheet and find a function that you are curious to try out. Include one or more examples of how the function works.Insert a new code block and write a mapping or plotting function. Remember, if you write a mapping function, it should probably include
ggplot2::geom_sf()in the body of the function.Finally—render the Quarto document and make sure it can be knit as an HTML page without error! You can also run
quarto::quarto_preview()in the console to keep a live preview running in the background while you complete the exercise.
For each part of this exercise, make sure to use function names that help you and anyone using your code understand what the function does. Using verbs is an easy way to do that.
Between each code block, please include a brief explanation of what question you are trying to answer with the functions.
For example, you could write: “This function takes data on storm observations and summarizes the average wind speed and air pressure by hurricane category so I can better understand the relationship between the continuous and categorical variables.”
When you are done writing the functions (and examples!), there are just two steps left in this exercise to help you practice working with Quarto.
- Add a link to your Exercise 7 document to the navigation menu of your Quarto website. Open the
_quarto.ymlproject configuration file and look for thenavbarsection. Take a look at the Quarto guide to Website Navigation for more information. - Explore the HTML theme options for your Quarto site. Try swapping the default
cosmotheme for one of the other Bootswatch themes.
3 Bonus exercise
Read in more data and try using your mapping or plotting function with a different dataset.
Does the function still work they way you expect? Why or why not?
Write a few sentences explaining what happens and, if the functions do not work, try writing a new version that works with both your original data and the new version.